Table of Contents
BEST IELTS Academic Writing Task 1, 3rd December
IELTS ACADEMIC WRITING TASK 1

IELTS ACADEMIC WRITING TASK 1
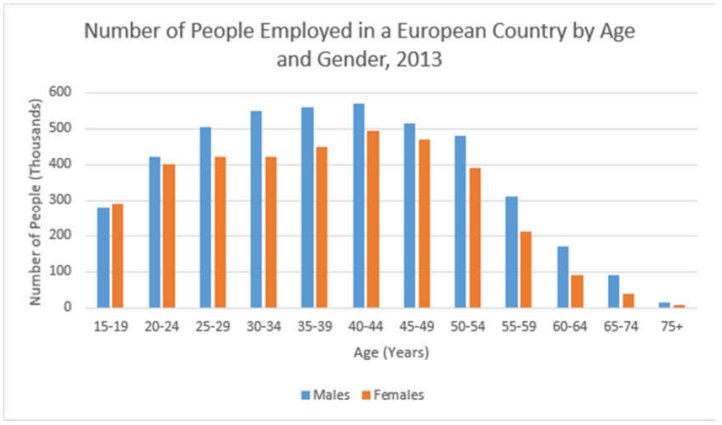
The graph below shows the number of males and females of different ages, employed in a European country in 2013. Summarise the information by selecting and reporting the main features, and make comparisons where relevant.


SAMPLE ANSWER
The chart gives information about employment in terms of age and sex in a European country in 2013.
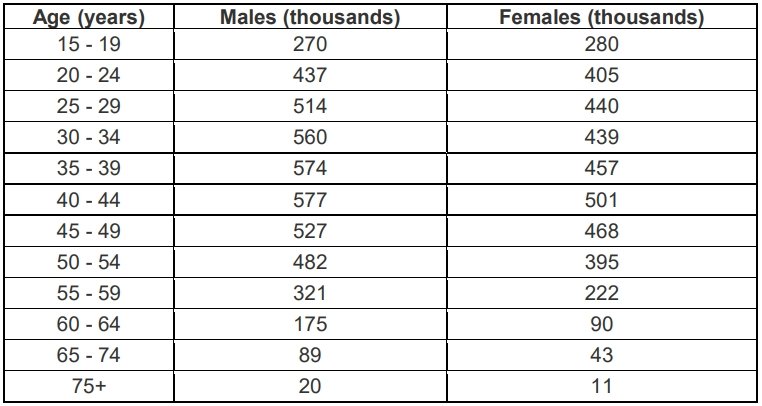
The most striking feature is that employed men outnumber employed women in all age groups apart from the 15-19 year age group, where women (approximately 280 000) slightly outnumber men (approximately 270 000).
Turning to differences in employment in terms of age group, it can be seen that the group with the highest participation in the workforce is aged between 35 and 44, with close to 1 200 000 male workers and almost 1 000 000 female workers. The age groups above and below this one, 25-34 and 45-54, are ranked second, with between 1 000 000 and 1 100 000 men and 830 000 to 850 000 women.
For female workers, next comes the 20-24 age group, followed by the group aged 55-64, and then the 15-19 year old group. For male workers, the group aged 55-64 is next, followed by the 20-24 age group and finally, the 15-19 year old group. The group with the lowest participation in the workforce is aged 65+, with around 100 000 men employed and half that number of female workers.
IELTS Academic Writing Task 1
