Table of Contents
BEST IELTS Academic Writing Task 1, 5th May
IELTS ACADEMIC WRITING TASK 1

IELTS ACADEMIC WRITING TASK 1
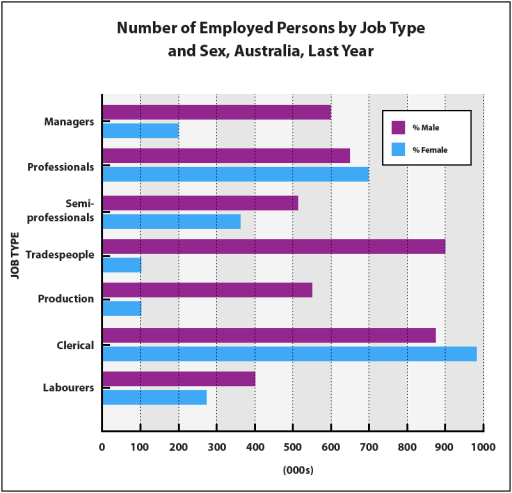
The bar chart shows the number of employed persons by job type and sex for Australia last year.
Summarise the information by selecting and reporting the main features, and make comparisons where relevant.

SAMPLE ANSWER
The bar chart illustrates the number of employed males and females across various job types in Australia last year.
Overall, males outnumbered females in most job categories except for clerical and professional roles. The highest male employment was seen among tradespeople, while clerical jobs had the largest number of female employees.
In detail, around 900,000 males were employed as tradespeople, significantly more than the approximately 100,000 females in the same category. Similarly, men dominated in production and labourer jobs, with each category employing over 600,000 males compared to fewer than 300,000 females.
Conversely, clerical roles had a far greater number of women (around 800,000) compared to men (about 300,000). Female professionals also slightly outnumbered their male counterparts. For managers and semi-professionals, men held more positions than women, though the gap was narrower compared to manual jobs.
In summary, employment in Australia last year showed clear gender divisions, with males prevalent in physical jobs and females in administrative and professional roles.
