Table of Contents
BEST IELTS Academic Writing Task 1, 27th March
IELTS ACADEMIC WRITING TASK 1

IELTS ACADEMIC WRITING TASK 1
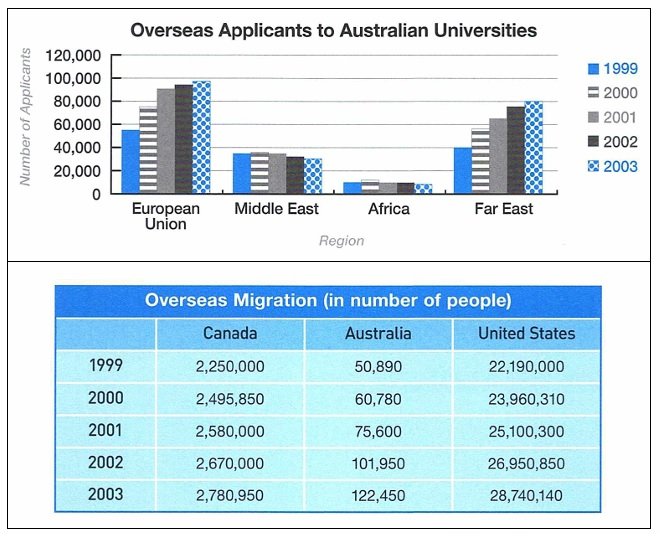
The chart illustrates the numbers of overseas applicants to Australian universities between 1999 and 2003, while the table shows overseas migration figures during the same period. Summarise the information by selecting and reporting the main features, and make comparisons where relevant.

SAMPLE ANSWER
The bar chart exhibits the numbers of foreign students applying to Australian universities from 1999 to 2003, and the table presents the figures of overseas migration to Canada, Australia and the United States during this period.
The European Union consistently recorded the largest number of Australian university applications, followed by the Far East region. Annual applications from the Middle East and Africa were at low levels only. In addition, the count of applications coming from these two regions generally declined year on year from 1999 to 2003, while the reverse was seen in applications from the European Union and the Far East. As of 2003, there were nearly 100,000 applicants from the European Union and 80,000 from the Far East. On the contrary, there were only around 30,000 applications from the Middle East, those from Africa were even less.
Incidentally, the overseas migration numbers show that each year, between 1999 and 2003, more and more people had been relocating to Australia. This data agrees with the observed yearly growth of Australian university applications from the European Union and the Far East.
In summary, the volume of overseas applications to Australian universities, particularly those from the European Union and the Far East, remained at high levels; what is more, they grew yearly from 1999 to 2003. This, in part, may have been steered by the rise in the count of migrants to Australia.
