BAR GRAPH VOCABULARY

Axis: A reference line on a graph, typically the horizontal (X-axis) or vertical (Y-axis) line, against which the values of the data are measured.
Sentence: The Y-axis on the bar graph represents the number of sales, while the X-axis shows the months of the year.
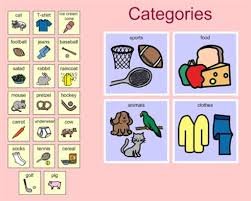
Categories: The different groups or classifications represented on a bar graph, typically listed along the X-axis.
Sentence: The bar graph shows the sales of different products in various categories, such as electronics, clothing, and groceries.
BAR GRAPH VOCABULARY
Frequency: The number of times a particular value or category occurs in the data.
Sentence: The bar graph displays the frequency of customer complaints received each month.

Scale: The set of values that represents the unit of measurement used for the graph, usually along the Y-axis.
Sentence: The scale on the Y-axis goes from 0 to 1000, with each increment representing 100 units.

Legend: A key or guide that explains the symbols, colors, or patterns used in a graph.
Sentence: The legend at the bottom of the bar graph indicates that the blue bars represent sales and the green bars represent returns.

Data Set: A collection of related data points that are used to create a graph.
Sentence: The data set for the bar graph includes the number of cars sold each month over the past year.

Compare: To examine two or more sets of data in order to note similarities or differences.
Sentence: The bar graph allows us to compare the population growth of different cities over the last decade.
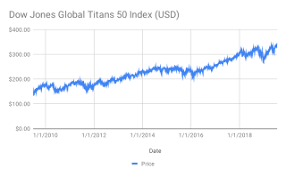
Trend: A general direction in which data is moving over time, which can be upward, downward, or stable.
Sentence: The bar graph clearly shows an upward trend in the number of tourists visiting the city every year.

Proportional: Relating to the relationship between two quantities where a change in one leads to a change in the other in a consistent way.
Sentence: The height of each bar in the graph is proportional to the number of units sold.
BAR GRAPH VOCABULARY

Label: A descriptive word or phrase used to identify a category or value on a graph.
Sentence: The labels on the X-axis include the names of each month of the year.

Interval: The distance or gap between two points on the scale of a graph.
Sentence: The intervals on the Y-axis are set at 10-unit increments for easier reading.

Clustering: The grouping of bars that represent data points that are close together in value.
Sentence: The bar graph shows clustering of sales figures for three months in the middle of the year, indicating a peak season.
Distribute: To spread data across categories or intervals.
Sentence: The bar graph effectively distributes the data across different age groups to show the popularity of the product.
BAR GRAPH VOCABULARY

BAR GRAPH VOCABULARY