Table of Contents
BEST IELTS Academic Writing Task 1, 26th October
IELTS ACADEMIC WRITING TASK 1

IELTS ACADEMIC WRITING TASK 1
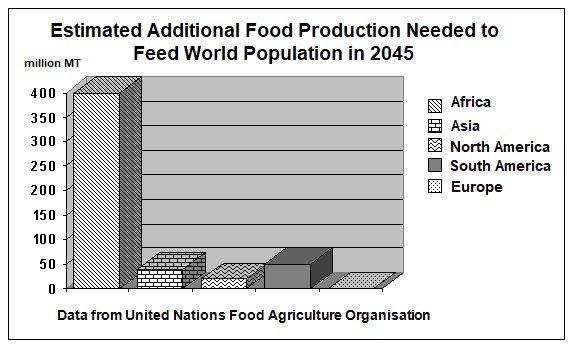
The given bar graph shows the estimated continent-wise increase in food production (in million MT) needed to feed the world population in 2045.
Summarise the information by selecting and reporting the main features, and make comparisons where relevant.

SAMPLE ANSWER
The bar graph depicts United Nations Food and Agriculture Organisation projections about additional food production (in million MT) required by the year 2045 to feed the population, across five continents, namely Africa, Asia, North America, South America and Europe.
It can be seen that the tallest bar is in respect of Africa. That means the greatest demand for food will come from this continent, reflecting an exponential rise in either its population size, or in per capita consumption, or both. More than 400 million MT will be needed to feed the population in this continent alone than what is needed today.
By comparison, the estimated additional food production required for other continents is quite small. Whereas South America will require an additional 50 million MT than what it requires today, Asia will need 30 million MT and North America will require around 15 million MT. The additional food requirement for Europe will be negligible or none at all.
Overall, even considering the relatively small additional food requirement in other continents, the world will still need a whopping 500 million MT or more food production by 2045, courtesy the huge requirement expected from Africa.
