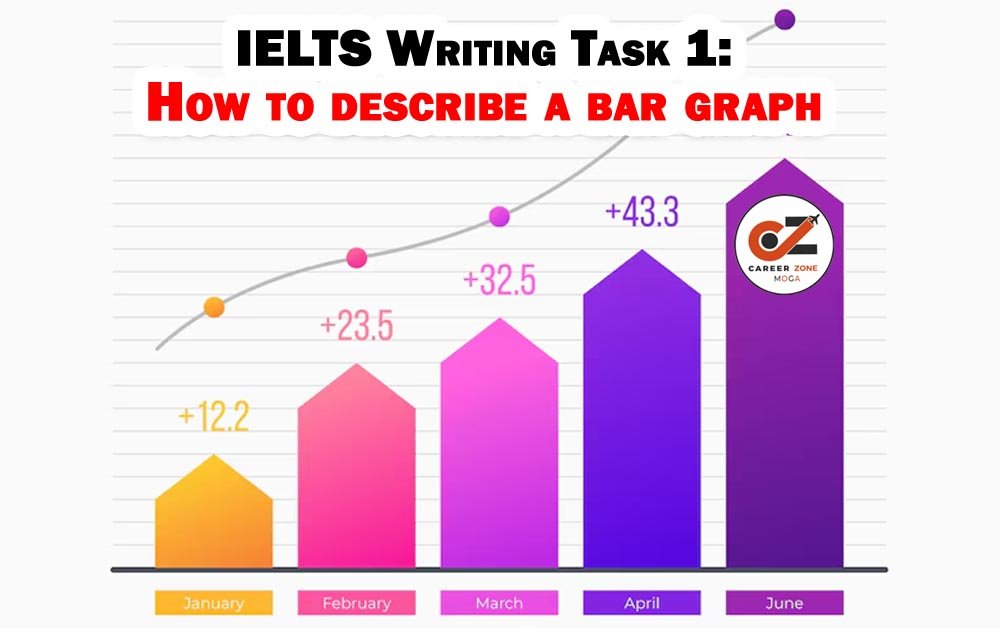
IELTS Writing Task 1: How to describe a bar graph
Describing a bar graph in IELTS Writing Task 1 requires a strategic approach to ensure clarity and coherence. Here are detailed tips to help you effectively analyze and present data in a bar graph format.
1. Understand the Task Requirements
– Familiarize Yourself with the Format: Know the structure expected in Task 1—introduction, overview, and detailed analysis.
– Read the Instructions Carefully: Understand what specific aspects you need to describe, such as comparisons, trends, and significant data points.
IELTS Writing Task 1
2. Analyze the Bar Graph
– Identify Key Elements: Look for titles, axes labels, legends, and categories. Note the units of measurement (e.g., thousands, percentages).
– Look for Trends and Patterns: Identify increases, decreases, peaks, and troughs in the data over time or between categories.
– Note Outliers: Pay attention to any data points that stand out significantly, whether high or low.
3. Plan Your Response
– Structure Your Writing: Follow a logical format: introduction, overview, detailed analysis, and a possible conclusion.
– Outline Key Points: Jot down major trends and data points you want to highlight.
IELTS Writing Task 1
4. Crafting the Introduction
– Paraphrase the Question: Restate what the graph represents in your own words. Include categories, time frames, and overall context.
– Be Concise: Aim for clarity; don’t overload the introduction with details.
5. Writing the Overview
– Summarize Key Trends: Highlight the most significant findings without going into specifics. This should encapsulate the general trend observed in the graph.
– Use General Language: Phrases like “Overview,” “in general,” or “it is evident that” can help transition into the overview.
6. Detailed Analysis
– Use Clear Structure: Break down the analysis into sections based on categories or time periods. Each paragraph can focus on a specific aspect.
– Be Specific: Cite exact figures to support your observations. For example, “The Art Museum had 20,000 visitors in July.”
– Make Comparisons: Use comparative language to highlight differences or similarities (e.g., “In contrast,” “Compared to,” “While,” “Whereas”).
– Describe Trends: Use phrases like “increased steadily,” “declined sharply,” or “remained stable” to describe the movement of data points.
IELTS Writing Task 1
7. Use Appropriate Vocabulary
– Employ Varied Vocabulary: Use synonyms to avoid repetition (e.g., “visitors” can also be referred to as “attendance”).
– Incorporate Data Language: Use terms like “percentage,” “proportion,” “ratio,” and “total” to articulate your points more effectively.
8. Pay Attention to Tenses
– Use Past Tense for Historical Data: If the graph represents data from the past, use the past tense (e.g., “The number of visitors was…”).
– Use Present Tense for General Statements: For descriptions that still hold true, use the present tense (e.g., “The Art Museum is popular…”).
IELTS Writing Task 1
9. Practice and Time Management
– Practice with Different Graphs: Familiarize yourself with various bar graphs to develop your analytical skills.
– Time Yourself: Practice writing your responses within the 20-minute timeframe to simulate exam conditions.
10. Review and Edit
– Check for Clarity: Make sure your points are easy to follow and logically structured.
– Proofread for Errors: Look for grammatical, spelling, and punctuation mistakes to enhance the quality of your writing.
IELTS Writing Task 1
11. Use Visual Language
– Create Mental Pictures: Describe the data in a way that allows readers to visualize the information (e.g., “The bars rise sharply in summer…”).
– Highlight Changes: Use phrases that illustrate change clearly, such as “The data reveals a significant rise in…” or “There was a notable drop in…”
By applying these tips, you can effectively describe a bar graph for IELTS Writing Task 1, demonstrating both your analytical abilities and your proficiency in English. Practice consistently, and you’ll be well-prepared for the exam.

IELTS Writing Task 1