Table of Contents
BEST IELTS Academic Writing Task 1, 17th September
IELTS ACADEMIC WRITING TASK 1

IELTS ACADEMIC WRITING TASK 1
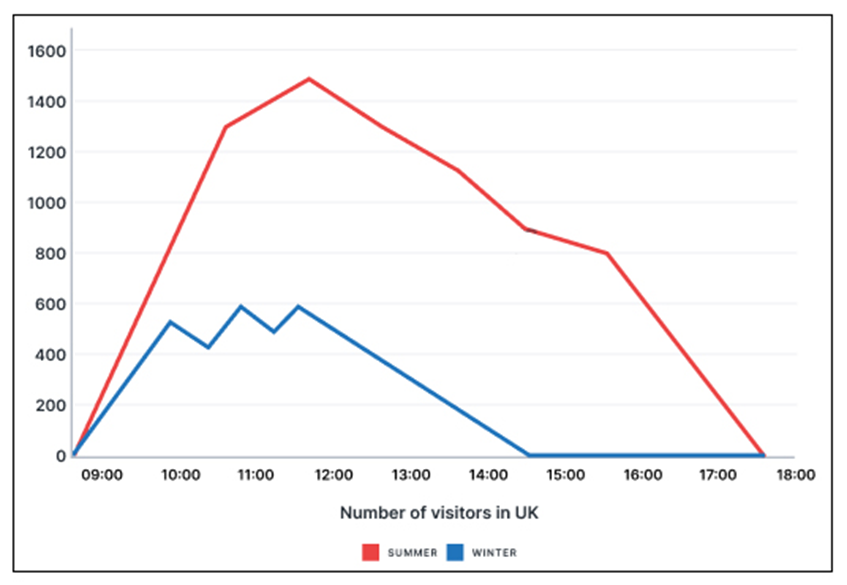
The graph shows information about the average number of visitors entering a museum in summer and winter in 2003. Summarize the information by selecting and reporting the main features, and make a comparison where relevant.
SAMPLE ANSWER
The line graph displays the average number of people visiting a particular museum in the UK during two seasons of 2005.
Overall, there was a higher attendance rate during the summer season compared to the winter one, with the peak time being midday on both seasons. It is noteworthy that the museum had the same opening time throughout the year, but it closed earlier during the latter.
During the summer season, the number of visitors increased significantly from 9 to 12 o’clock, reaching a peak of around 1500 visitors between 11 o’clock and noon. There was then a decline in visitor numbers by 4:00 PM, followed by a sharp fall towards 5:30 PM, the museum’s closing time, after which no visitors were registered.
Concerning the winter season, its figures followed a comparable pattern, although at a lower rate. Despite some fluctuations, there was a significant risebetween 9 o’clock and noon, with the highest attendance of 600 people being recorded at noon. After that, a consistent decrease in attendance was observed, until the number dropped. dropped to zero as the museum closed its doors at around 2:30 PM.

IELTS ACADEMIC WRITING TASK 1