Table of Contents
BEST IELTS Academic Writing Task 1, 12th April
IELTS ACADEMIC WRITING TASK 1

IELTS ACADEMIC WRITING TASK 1
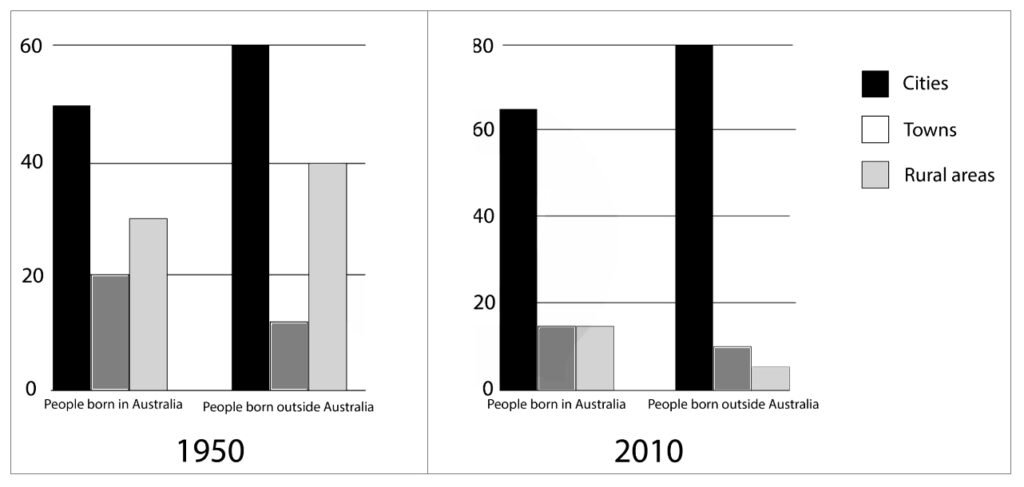
The bar chart below describes some changes about the percentage of people were born in Australia and who were born outside Australia living in urban, rural and town between 1995 and 2010. Summarise the information by selecting and reporting the main features and make comparisons where relevant.

SAMPLE ANSWER
The bar charts illustrate the distribution of people born in and outside Australia who lived in cities, towns, and rural areas in 1995 and 2010.
Overall, the majority of people, both born in and outside Australia, lived in cities in both years. However, rural areas saw a significant decline, especially among people born outside Australia.
In 1995, around 50% of people born in Australia lived in cities, while about 60% of those born outside Australia lived in urban areas. Towns were less populated, with approximately 20% of Australian-born people and 10% of foreign-born residents living there. Rural areas had a noticeable number of people, around 30% of those born in Australia and 40% of those born overseas.
By 2010, the percentage of people living in cities increased for both groups—reaching around 65% for Australian-born and 80% for those born overseas. In contrast, both towns and rural areas experienced a decline. Less than 20% of people lived in towns, and rural areas became the least populated, with fewer than 10% of foreign-born and about 15% of Australian-born residents.
