Table of Contents
BEST IELTS Academic Writing Task 1, 29th March
IELTS ACADEMIC WRITING TASK 1

IELTS ACADEMIC WRITING TASK 1
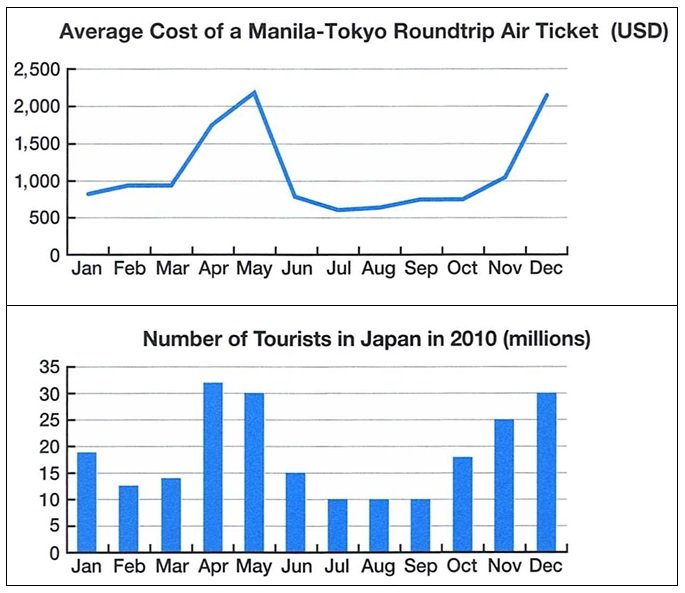
The line graph shows the monthly average cost of a two-way air ticket from Manila to Tokyo for a year, while the bar graph illustrates the number of tourists in Japan in 2010.
Summarise the information by selecting and reporting the main features, and make comparisons where relevant.

SAMPLE ANSWER
The line graph shows the monthly average cost of a round-trip air ticket from Manila to Tokyo for one year. Meanwhile, the bar graph illustrates the number of tourists in Japan per month in 2010.
Starting off, the cost of Manila-Tokyo plane tickets were about $800 in January, which continued to increase until it peaked at $2,250 in May. A dramatic decline to around $750 followed in June and stayed in the $600-to-$1000 price range until November. After that was a steady and then sharp rise, ending at approximately $2,200 in December.
The second chart displayed a fluctuating number of tourists in Japan in 2010. Tourism was highest during April, May, and December with 30 million give or take a few each month. It was slightly lower in November at 25 million and the rest of the months had a visitor log within the range of 10 million to 18 million.
In summary, April, May, and December are when the two-way air ticket from Manila to Tokyo reaches its peak. Despite that, it is also the same months when the number of tourists is highest.
