Table of Contents
BEST IELTS Academic Writing Task 1, 24th March
IELTS ACADEMIC WRITING TASK 1

IELTS ACADEMIC WRITING TASK 1
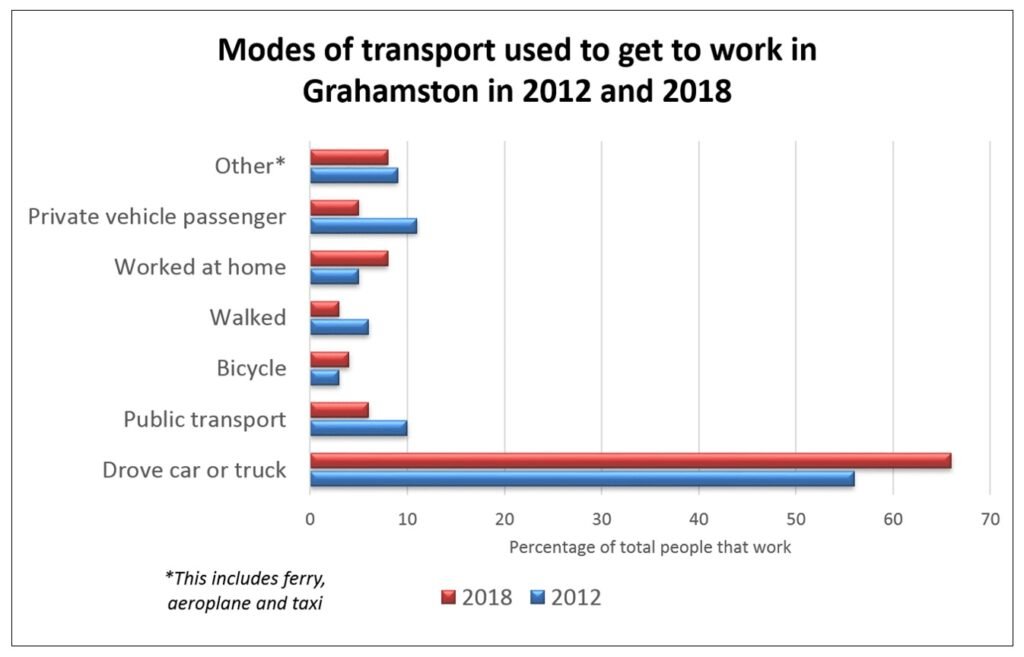
The chart shows how people travelled to work in 2012 and 2018.
Summarise the information by selecting and reporting the main features, and make comparisons where relevant.

SAMPLE ANSWER
The information regarding various modes of transport used by people to commute for work in Grahamston during the year 2012 and 2018 is depicted by the tabular chart. The data is calibrated in percentile.
Having an overview, it is crystal clear that people drove to work prominently during the mentioned years. Whereas, only few used walking and cycling as the mode to reach to work.
After having a myopic observation, it can be observed that about 55% of individuals in 2012 used car to commute to work which raised by 10% over the period of 6 years. While, the second best was using private vehicle as transport by the commoners in Grahamston; more than 10 % of people used it during 2018 and was less than 5% during 2012.
On further analysis of the tabular chart, the least preferred mode of transport used by the habitants of Grahamston for work is walking and bicycling, which was recorded less than 5% during the mention years. Whereas, some individuals of slightly less than 10 % and remained almost stable during 2018 as well as 2012 used other modes of transport which includes ferry, airplane and taxi.
