Table of Contents
BEST IELTS Academic Writing Task 1, 25th December
IELTS ACADEMIC WRITING TASK 1

IELTS ACADEMIC WRITING TASK 1
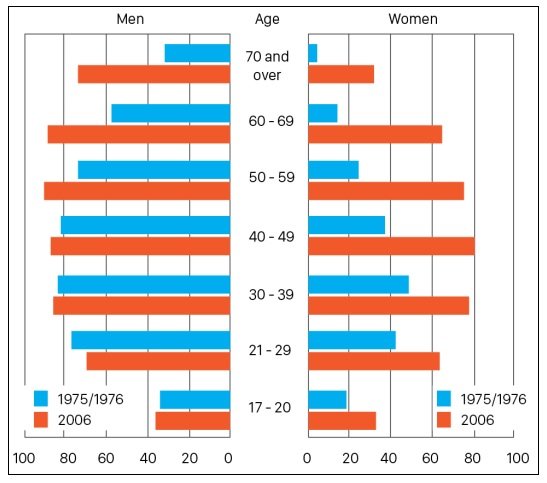
The graphs below show the percentage of people holding full driving licences In Great Britain by age and sex.
Summarise the information by selecting and reporting the main features, and make comparisons where relevant.

SAMPLE ANSWER
The bar charts compare the growth in holders of full car driving Licences by age and sex between 1975 and 2006.
By 2006 the percentage of male licence holders peaked at just over 90% al ages 50-59 and over 85% for all ages from 30 to 69. Compared to 1975/76, there was a slight decrease in the percentage for males at ages 21-29, whilst the increases in certain other categories were slight: about 1% for the 17-20 and 30-39 categories, for example. Increases were more significant for older age groups, with the 70+ category doubling.
For females, in comparison, the increase over the 30-year period has been far greater amongst all age groups. For example, while just over 80% of males in the 40-49 category held a driving licence in 1975/76, rising to almost 90% in 2006, the percentage of women in the same category more than doubled, from just below 40% in 1975/76 to almost 80% in 2006.
The percentage of women licence holders between 60 and 69 has more than trebled to over 60%, and the figure for the over-70s has increased by approximately six times to 30%. These figures appear to show that the numbers of female and elderly licence holders have increased in line with their greater economic independence over this period.
