Table of Contents
BEST IELTS Academic Writing Task 1, 11th December
IELTS ACADEMIC WRITING TASK 1

IELTS ACADEMIC WRITING TASK 1
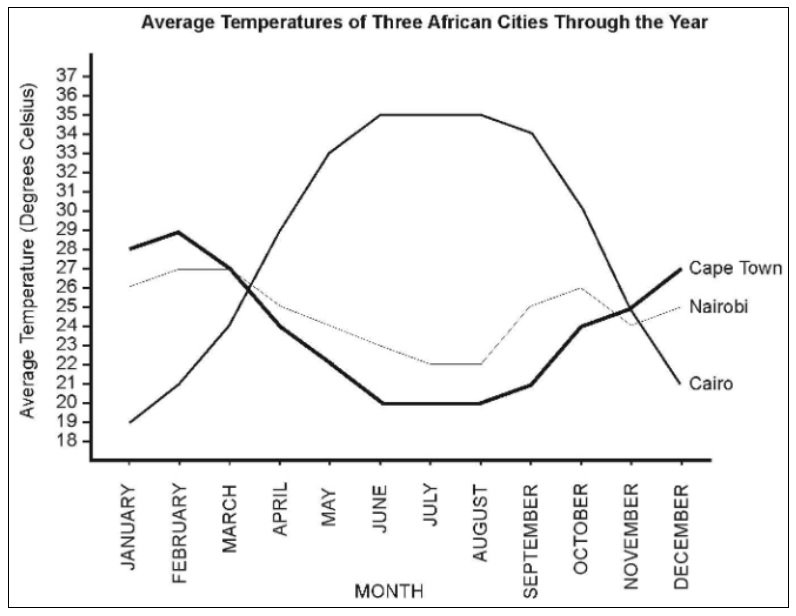
The line graph below shows the average temperatures of three African cities through the year. Summarise the information by selecting and reporting the main features, and make comparisons where relevant.

SAMPLE ANSWER
The line graph illustrates the average temperatures through the year of three African cities. The three cities’ geographical location is well spread, with Cairo being in the north of the African continent, Cape Town in the south and Nairobi being centrally placed in terms of latitude.
Cairo’s temperatures follow a northern hemisphere seasonal change. January starts relatively warm at 19 degrees Celsius and there is then a steady rise to an average of 35 degrees from June to August. From then on, there is a steady drop to an average of 21 degrees Celsius in December.
Cape Town shows a mirror image of these trends, being in the southern hemisphere. Although there is a slight rise from January to February from 28 to 29 degrees Celsius, there is then a steady drop to an average of 20 degrees Celsius from June to August. From then on, there is a steady rise in temperatures to 27 degrees Celsius in December.
Nairobi does not show the same extremes of temperature, as it is an equatorial country. Throughout the whole year, average temperatures range from 22 to 27 degrees Celsius, though there is what looks like some kind of seasonal drop between April and September.
The three countries’ climates are all warm and their average temperatures all seem to accurately reflect their geographical location.
